Sorting as bars
Bubble sort as coloured bars: the pair being compared lights up and you see each swap. Teaches sorting, your own function and drawing rectangles.
Open in Tokbit Level: Expert. Free in the browser, nothing to install, no account needed.
Run the example in Tokbit and step through it: before each step say what will happen and check it in the Variables panel. Then change it your way.
Flowchart
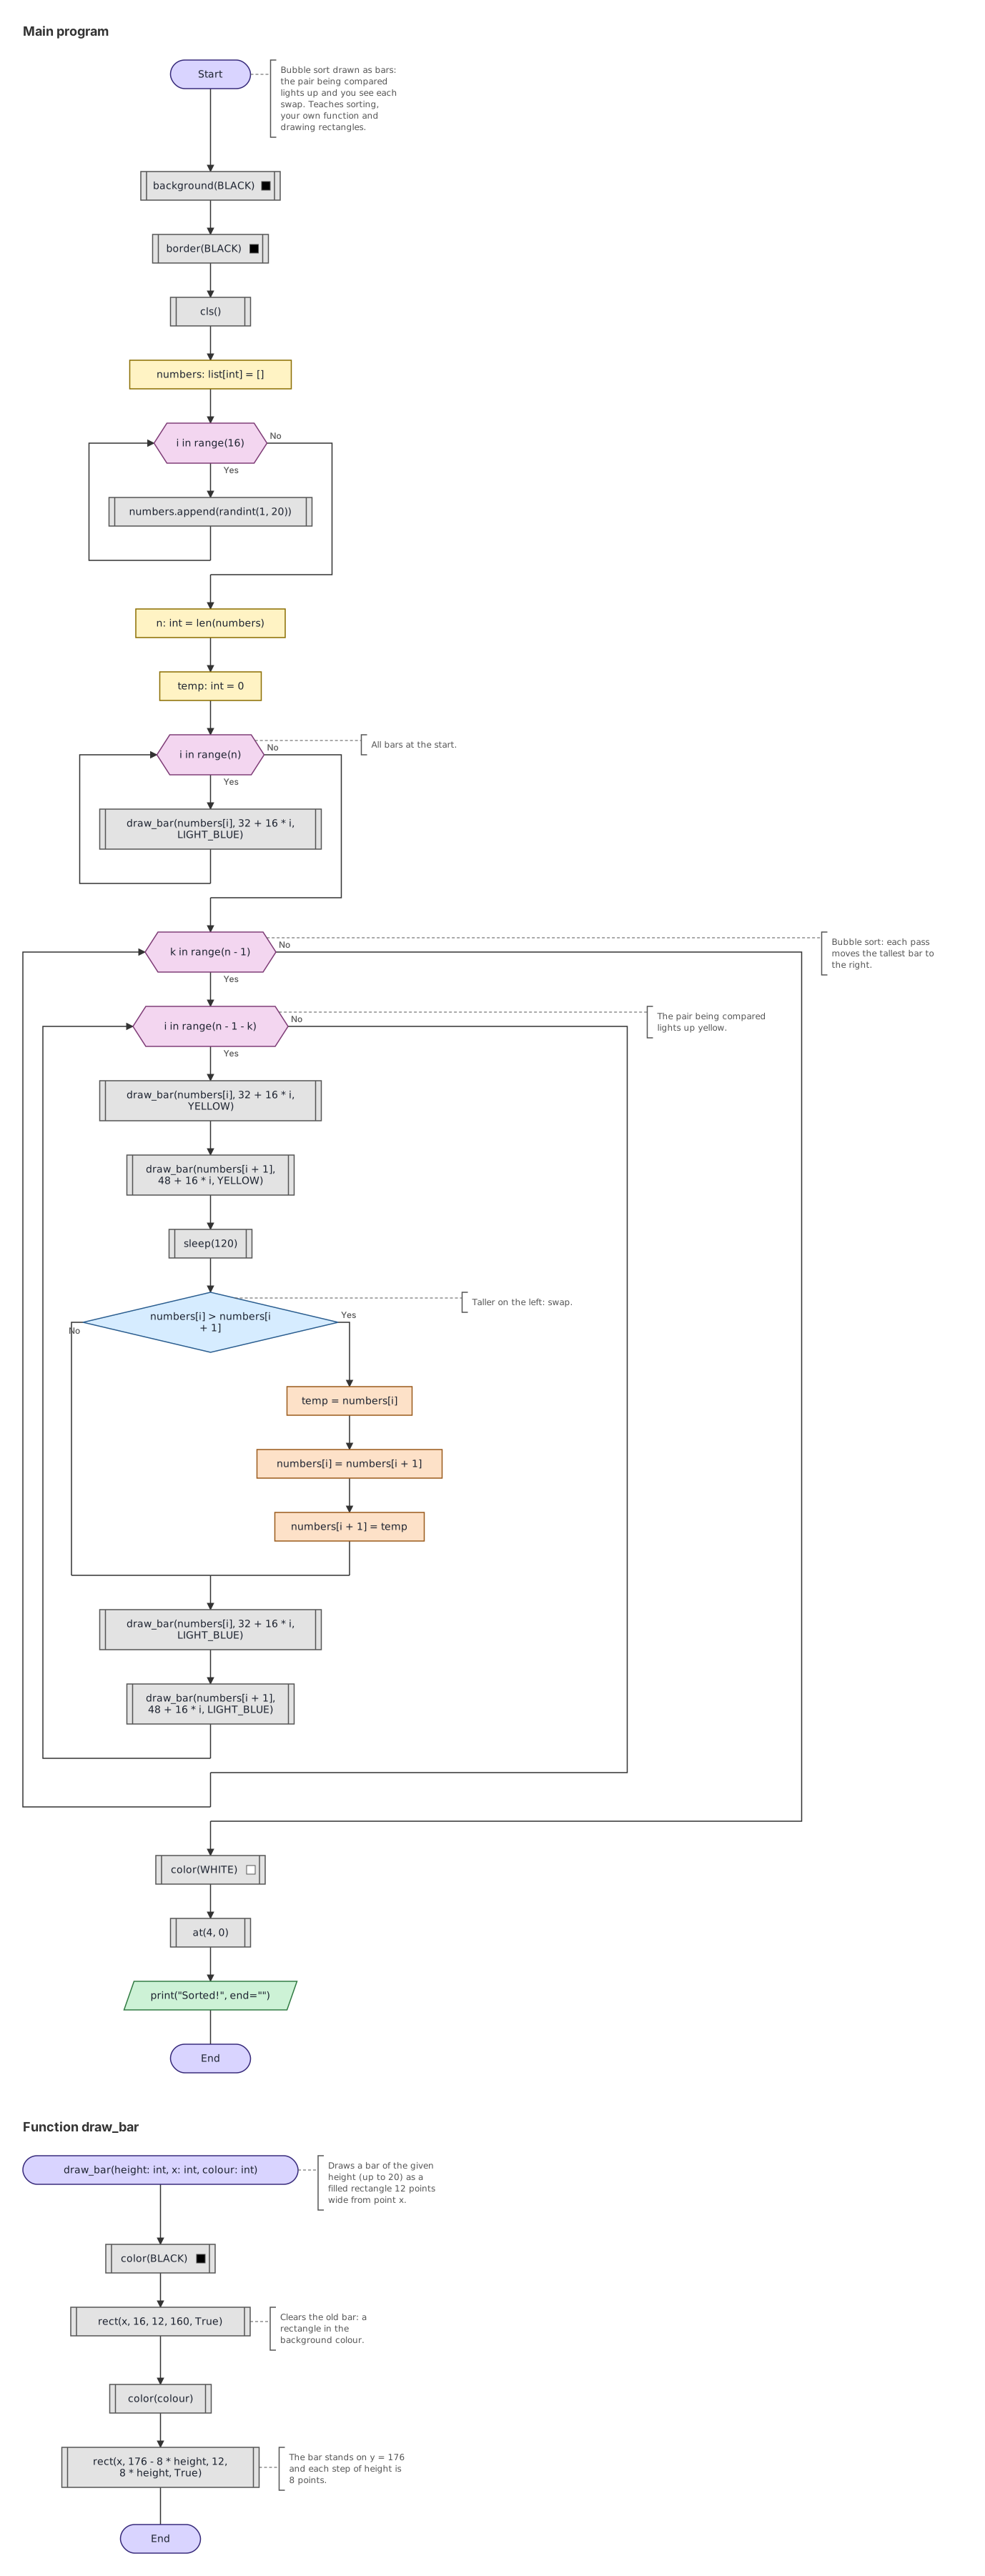
Python program
The same program as Python code. In Tokbit you see it when you switch from Diagram to Python above the flowchart.
"""Bubble sort drawn as bars: the pair being compared lights up and you see each swap. Teaches sorting, your own function and drawing rectangles."""
from random import randint
# Tokbit screen functions, not in plain Python:
from tokbit import (
    cls, at, color, background, border, sleep, rect, BLACK, WHITE, YELLOW,
    LIGHT_BLUE,
)

def draw_bar(height: int, x: int, colour: int):
    """Draws a bar of the given height (up to 20) as a filled rectangle 12 points wide from point x."""
    color(BLACK)
    # Clears the old bar: a rectangle in the background colour.
    rect(x, 16, 12, 160, True)
    color(colour)
    # The bar stands on y = 176 and each step of height is 8 points.
    rect(x, 176 - 8 * height, 12, 8 * height, True)

background(BLACK)
border(BLACK)
cls()
numbers: list[int] = []
for i in range(16):
    numbers.append(randint(1, 20))
n: int = len(numbers)
temp: int = 0
# All bars at the start.
for i in range(n):
    draw_bar(numbers[i], 32 + 16 * i, LIGHT_BLUE)
# Bubble sort: each pass moves the tallest bar to the right.
for k in range(n - 1):
    # The pair being compared lights up yellow.
    for i in range(n - 1 - k):
        draw_bar(numbers[i], 32 + 16 * i, YELLOW)
        draw_bar(numbers[i + 1], 48 + 16 * i, YELLOW)
        sleep(120)
        # Taller on the left: swap.
        if numbers[i] > numbers[i + 1]:
            temp = numbers[i]
            numbers[i] = numbers[i + 1]
            numbers[i + 1] = temp
        draw_bar(numbers[i], 32 + 16 * i, LIGHT_BLUE)
        draw_bar(numbers[i + 1], 48 + 16 * i, LIGHT_BLUE)
color(WHITE)
at(4, 0)
print("Sorted!", end="")