Function graph
Draws the axes and a graph of the sine function. Teaches screen coordinates, turning values into points and drawing lines.
Open in Tokbit Level: Expert. Free in the browser, nothing to install, no account needed.
Run the example in Tokbit and step through it: before each step say what will happen and check it in the Variables panel. Then change it your way.
Flowchart
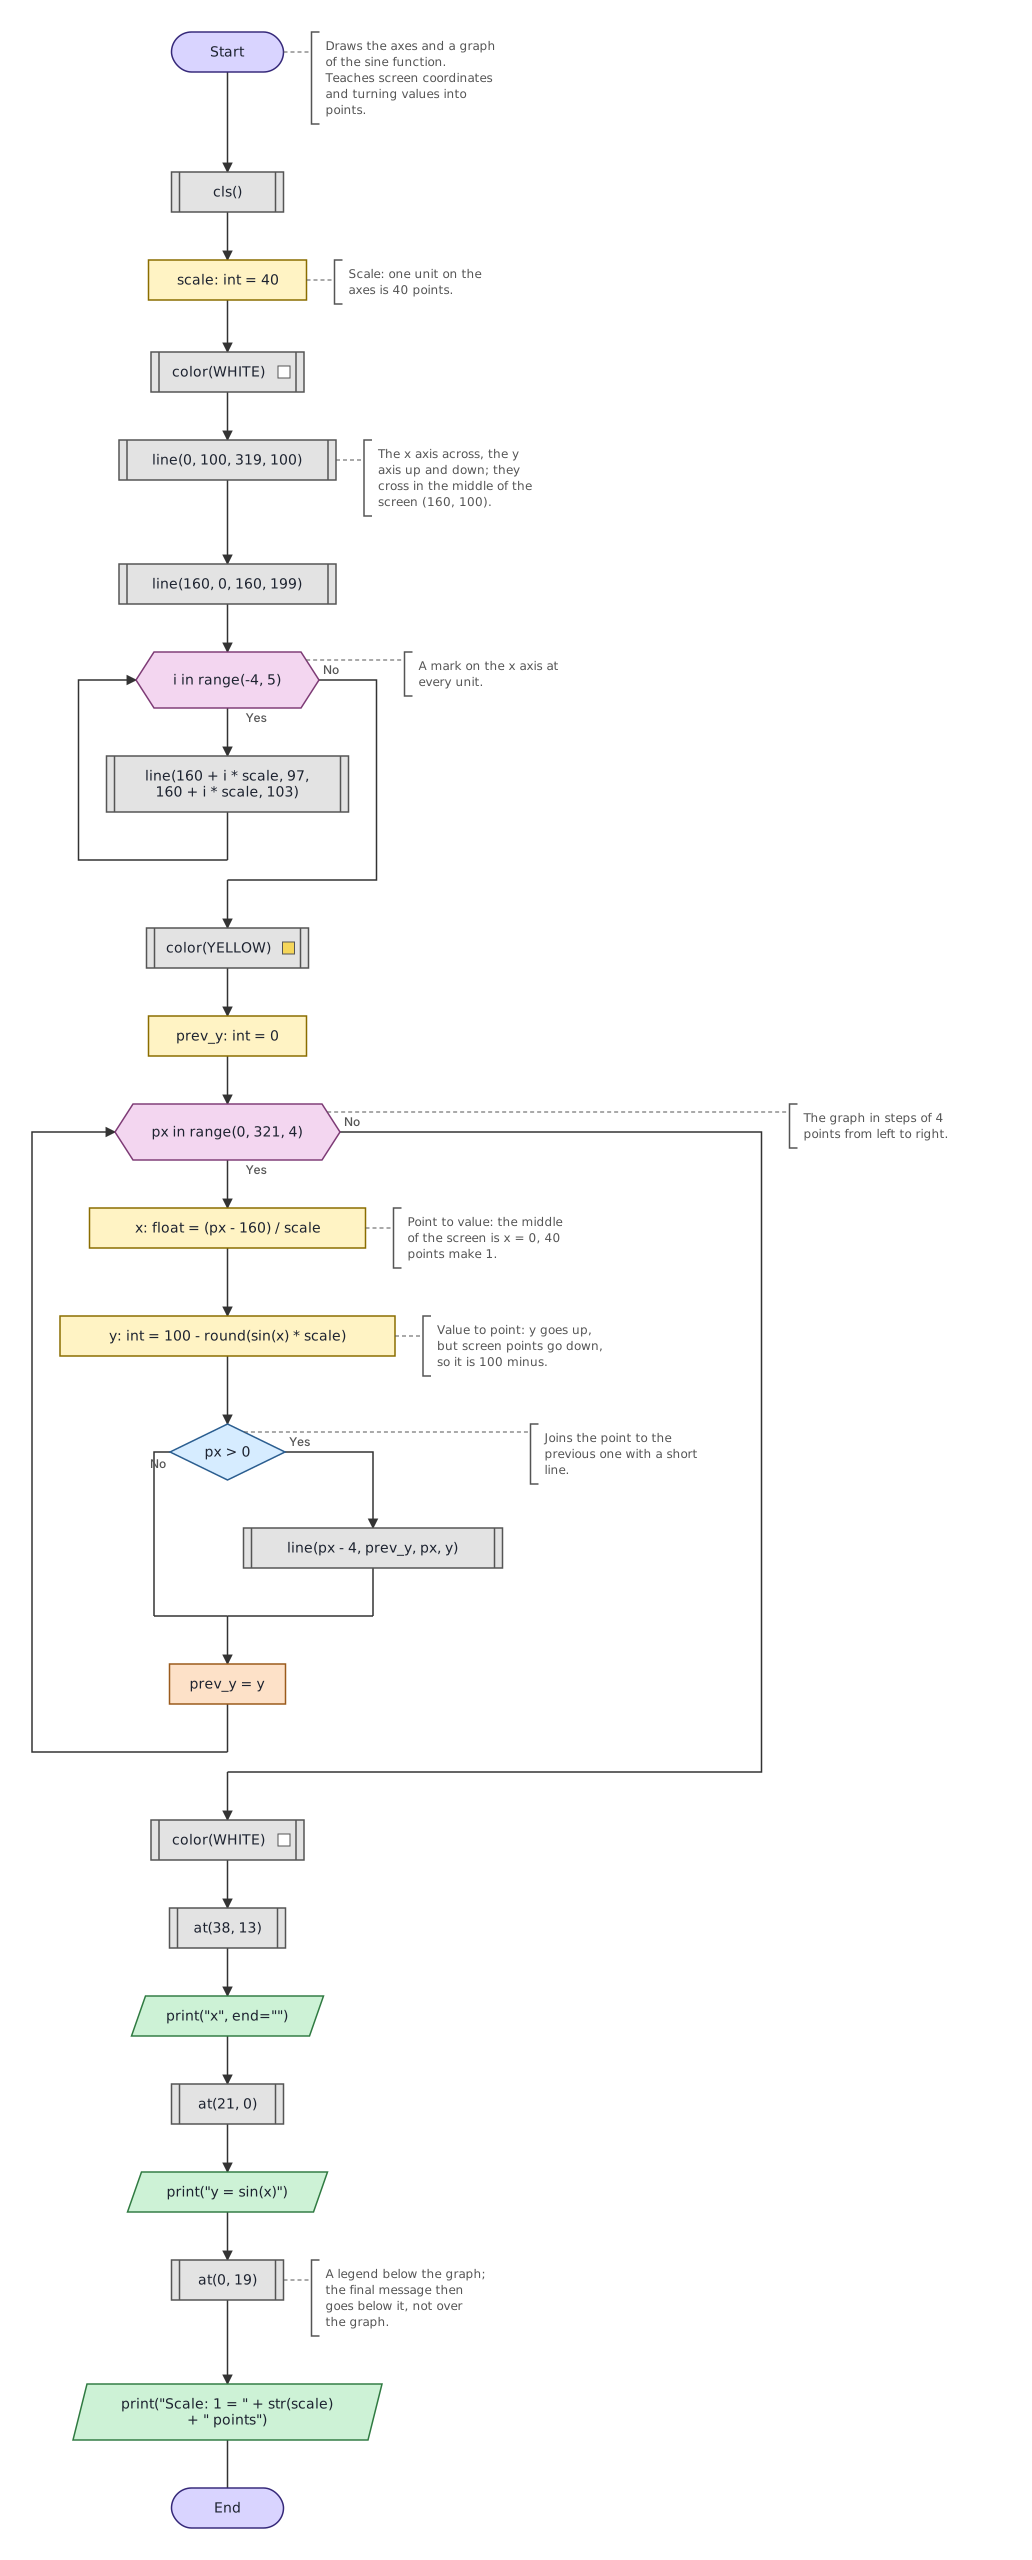
Python program
The same program as Python code. In Tokbit you see it when you switch from Diagram to Python above the flowchart.
"""Draws the axes and a graph of the sine function. Teaches screen coordinates and turning values into points."""
from math import sin
# Tokbit screen functions, not in plain Python:
from tokbit import cls, at, color, line, WHITE, YELLOW

cls()
# Scale: one unit on the axes is 40 points.
scale: int = 40
color(WHITE)
# The x axis across, the y axis up and down; they cross in the middle of the screen (160, 100).
line(0, 100, 319, 100)
line(160, 0, 160, 199)
# A mark on the x axis at every unit.
for i in range(-4, 5):
    line(160 + i * scale, 97, 160 + i * scale, 103)
color(YELLOW)
prev_y: int = 0
# The graph in steps of 4 points from left to right.
for px in range(0, 321, 4):
    # Point to value: the middle of the screen is x = 0, 40 points make 1.
    x: float = (px - 160) / scale
    # Value to point: y goes up, but screen points go down, so it is 100 minus.
    y: int = 100 - round(sin(x) * scale)
    # Joins the point to the previous one with a short line.
    if px > 0:
        line(px - 4, prev_y, px, y)
    prev_y = y
color(WHITE)
at(38, 13)
print("x", end="")
at(21, 0)
print("y = sin(x)")
# A legend below the graph; the final message then goes below it, not over the graph.
at(0, 19)
print("Scale: 1 = " + str(scale) + " points")